DBSCAN is an unsupervised learning clustering algorithm that classifies points according to the density of their surrounding area. Unlike K-Means, it is perfect for complicated datasets because it can detect clusters of different sizes and shapes.
Key concepts
- Core Points: A point is classified as a core point if it has at least min_samples points (including itself) within a specified radius eps.
- Border Points: Border points are within the eps radius of a core point but do not meet the min_samples criterion.
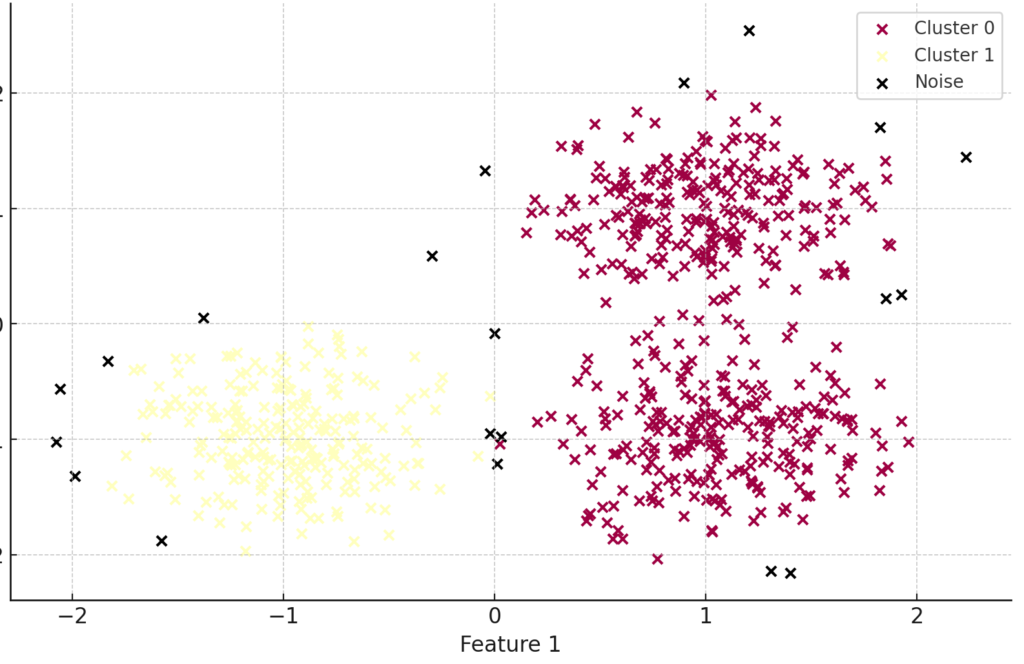
- Noise Points: Points that do not fall within the eps radius of any core points.
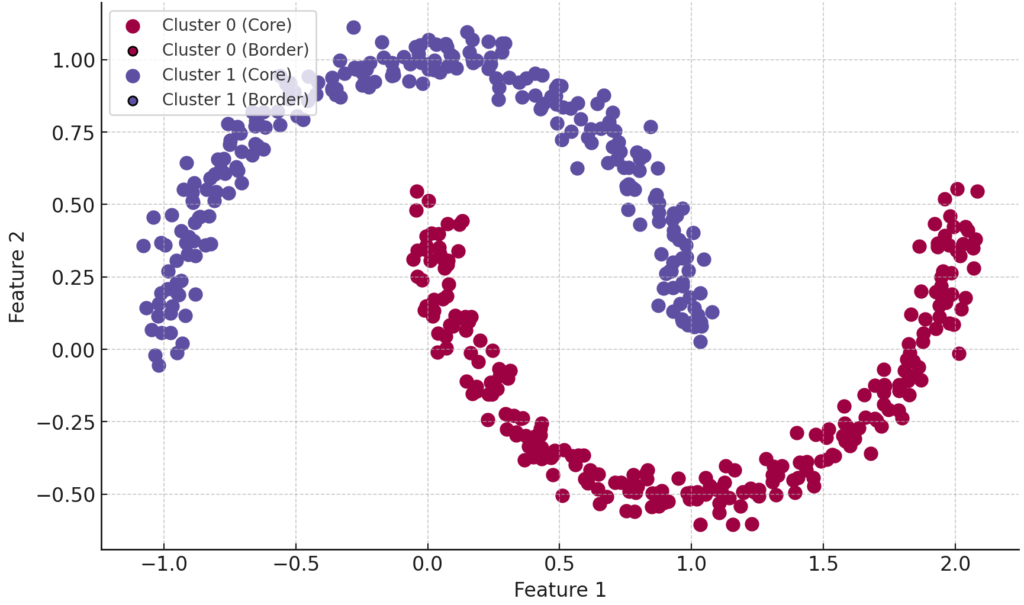
The graph of DBSCAN clustering with core, border, and noise points is shown in Figure 1 and 2.

Figure 1

Figure 2
Practical example:
Consider customer data in a shopping mall where each customer is represented by features like time spent in the store and money spent. DBSCAN can identify groups of customers with similar behaviors and isolate those with unusual shopping patterns (outliers).
Step-by-step:
- Load a dataset
- Apply the DBSCAN algorithm using sklearn
- Visualize the clusters and outliers
- Explain the results
import numpy as np
import matplotlib.pyplot as plt
from sklearn.cluster import DBSCAN
from sklearn.datasets import make_moons

# Step 1: Create a synthetic dataset (e.g., two interleaving half circles)
X, _ = make_moons(n_samples=500, noise=0.05, random_state=42)

# Step 2: Apply the DBSCAN algorithm
dbscan = DBSCAN(eps=0.2, min_samples=5)
labels = dbscan.fit_predict(X)

# Step 3: Visualize the results
plt.figure(figsize=(10, 6))
unique_labels = set(labels)
colors = [plt.cm.Spectral(each) for each in np.linspace(0, 1, len(unique_labels))]

for label, color in zip(unique_labels, colors):
    if label == -1:
        color = [0, 0, 0, 1]  # Black for noise
    plt.scatter(X[labels == label, 0], X[labels == label, 1], c=[color], label=f'Cluster {label}')

plt.title('DBSCAN Clustering')
plt.xlabel('Feature 1')
plt.ylabel('Feature 2')
plt.legend()
plt.show()
Explanation:
- Generate Synthetic Data: We use make_moons() from sklearn.datasets to create a dataset with two interleaving half circles. This dataset is challenging for algorithms like K-Means but suitable for DBSCAN.
- Apply DBSCAN: We create an instance of DBSCAN with eps=0.2 and min_samples=5 and fit it to the data. The fit_predict() method assigns a cluster label to each point. Points labeled -1 are considered noise.
- Visualize the Clusters: We use matplotlib to plot and color the data points according to their cluster label. Noise points are shown in black.

