Introduction to Vectors
Vectors are fundamental mathematical entities that describe both magnitude and direction. They are widely used in various fields, from physics and engineering to computer science and machine learning. Understanding vectors allows us to model real-world phenomena, from movement in physics to data representation in artificial intelligence.
Imagine standing at a crossroads, unsure which path to take. Each direction represents a unique journey, leading to different destinations. Similarly, in mathematics, vectors help navigate different directions and magnitudes in multi-dimensional spaces.
Basic Properties of Vectors
A vector is characterized by
- Magnitude: The length of the vector.
- Direction: The orientation in space.
- Representation: Typically represented as arrows in 2D/3D spaces or as numerical values in matrices.
Vectors can be denoted mathematically as v=(x, y, z) in a three-dimensional space.
Mathematical Representation of Vectors
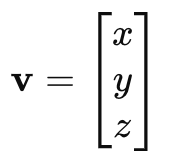
Vectors are often written in:
- Column vector form:

- Row vector form:
$$
\mathbf{v} =
\begin{bmatrix}
x \
y \
z
\end{bmatrix}
$$
These representations make it easier to perform mathematical operations such as addition, subtraction, and matrix transformations.
Types of Vectors
Vectors can be categorized into different types:
- Zero vector: A vector with zero magnitude.
- Unit vector: A vector with a magnitude of 1.
- Position vector: Represents a point in space.
- Basis vector: Standard vectors used in coordinate systems.
- Velocity vector: Represents speed and direction of an object
Vector Operations and Their Importance
Vectors support various mathematical operations:
- Addition & Subtraction:
- a + b = (x₁ + x₂ , y₁ + y₂ , z₁ + z₂)
- Represents combining forces or movements.
- Scalar Multiplication:
- Scaling a vector’s magnitude while maintaining direction.
- Dot Product:
- Measures the angle between two vectors:
- a ⋅ b = ∣a∣∣b∣ cos(θ)
- Used in physics and machine learning.
- Measures the angle between two vectors:
- Cross Product:
- Produces a perpendicular vector:
- a × b= ∣a∣∣b∣ sin(θ)n
- Essential in physics and 3D modeling.
- Produces a perpendicular vector:
Vectors in Linear Transformations
Vectors play a crucial role in linear algebra. In machine learning, data is stored as vectors within matrices. Operations like matrix multiplication and transposition help transform data for various models.
A commonly used transformation is standardization (Z-score normalization):
$$X_{standardized} = \frac{X – \mu}{\sigma}$$
where:
- X is the dataset feature
- μ is the mean
- σ is the standard deviation
This transformation ensures that data has a mean of zero and a standard deviation of one, improving model performance.
Vectors in Machine Learning
Machine learning relies heavily on vector representations:
- Data Representation: Features in datasets are structured as vectors.
- Model Parameters: Weights and biases in neural networks are vectors.
- Gradient Descent: Optimization algorithms use vector calculus.
For example, in image classification, each pixel’s intensity can be represented as a vector, enabling deep learning models to identify patterns. Let’s examine real-life data representation by the vector approach with a classification task example.
A sample dataset of animals has two features: height in centimeters and weight in kg. Our goal is to categorize animals into two groups, which are tigers and elephants, based on their height and weight.
| Animal | Height (cm) | Weight (kg) |
|---|---|---|
| Tiger | 105 | 210 |
| Elephant | 350 | 2000 |
| Tiger | 120 | 300 |
| Elephant | 370 | 2500 |
In this example, each row of the dataset is considered a vector. Every vector is one animal, and it is also represents height and weight. A first vector representing the first animal, the tiger, is : [105, 210] and second vector, the elephant, is [350, 2000] goes on and so does.
What you see below is a vector matrix that was derived from our dataset. Each row in this matrix represents an animal, and each column corresponds to a feature, e.g., height, weight.
\[\begin{bmatrix}
105 & 210 \\
350 & 2000 \\
120 & 300 \\
370 & 2500
\end{bmatrix}\]
Thanks to this vector representation, we can use our dataset as an input of different ML algorithms to do tasks such as classification. In other words, we could teach our learning tools (logistic regression or neural networks) how the examples of features (height and weight) correlate with animal categories (tiger and elephant) to let us classify new animals based on their height and weight.

import numpy as np
from sklearn.preprocessing import StandardScaler

# Define the animal dataset
data = np.array([
    [105, 210],  # Tiger
    [350, 2000], # Elephant
    [120, 300],  # Tiger
    [370, 2500]   # Elephant
])

# Apply Standard Scaler function on Animal dataset
scaler = StandardScaler()
scaler.fit(data)
scaled_data = scaler.transform(data)

# Formatted to 4 decimal places
scaled_data_formatted = np.around(scaled_data, decimals=4)

# Print Result
print("Animal Dataset (Original):")
print(data)
print("\nAnimal Dataset (Scaled):")
print(scaled_data_formatted)
Vectors in NLP and Computer Vision
- NLP
- Words are embedded into vectors using Word2Vec or GloVe.
- These vectors capture relationships between words based on context.
- Computer Vision
- Images are represented as pixel intensity vectors.
- CNNs use filters that act as vector-based feature extractors.
FAQs
1. What is a vector in simple terms?
A vector is a mathematical entity that has both magnitude and direction, often represented as an arrow in space.
2. How are vectors used in real life?
Vectors are used in physics (forces, velocity), engineering (structural analysis), and computer science (graphics, AI, and ML).
3. What is the difference between a scalar and a vector?
A scalar has only magnitude (e.g., temperature), while a vector has both magnitude and direction (e.g., velocity).
4. Why are vectors important in machine learning?
Vectors help represent data, model parameters, and transformations in machine learning algorithms.
5. How do vectors help in natural language processing?
Vectors allow computers to understand words and phrases by embedding them into numerical representations based on meaning and context.
6. What is an example of a vector transformation?
Scaling a vector or rotating it using a transformation matrix is an example of vector transformation.

