
Introduction to K-Means Clustering
K-Means Clustering is one of the most widely used unsupervised learning algorithms for data segmentation. It is a simple yet powerful method that partitions a dataset into K distinct clusters, ensuring that data points within each cluster are more similar to each other than to those in other clusters.
K-Means is widely used in customer segmentation, image recognition, market analysis, and pattern detection. This article explores how K-Means works, its mathematical formulation, and its implementation in Python.
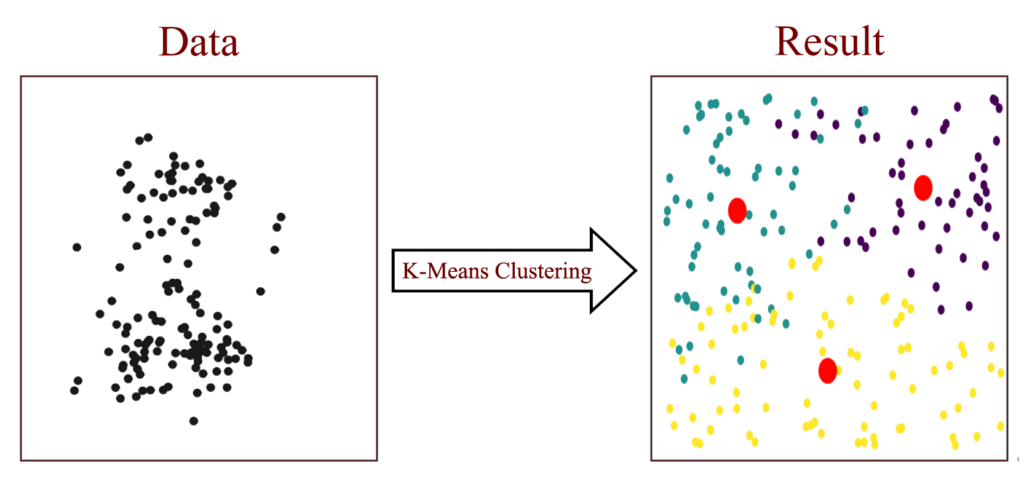
Figure 1
Understanding Clustering in Machine Learning
Clustering is a fundamental technique in unsupervised learning, where an algorithm groups data points without predefined labels. It is mainly used for:
- Pattern recognition: Identifying similar patterns in datasets.
- Anomaly detection: Detecting unusual data points in cybersecurity or fraud detection.
- Data compression: Reducing data complexity by grouping similar values.
📌 Types of Clustering Algorithms
- Partition-based (e.g., K-Means, K-Medoids)
- Density-based (e.g., DBSCAN, OPTICS)
- Hierarchical (e.g., Agglomerative, Divisive Clustering)
K-Means belongs to the partition-based clustering category and is highly efficient for large datasets.
📌 How K-Means Clustering Works
Here is how it works:
- Choosing K Centroids
- Randomly initializing K centroids (cluster centers). These are represented as: $${ \mathbf{𝜇}_1, \mathbf{𝜇}_2 , …, \mathbf{𝜇}_k }$$
- Assigning Data Points to Clusters
- Each data point is assigned to the nearest centroid, forming K clusters. This is determined using the Euclidean distance: $$C_k = { \mathbf{x}_i : |\mathbf{x}_i – \mu_k|^2 \leq |\mathbf{x}_i – \mu_j|^2 \text{ for all } j = 1, \ldots, K }$$
- Updating Centroids
- Each centroid is recalculated as the mean of all assigned points: $$\mu_j = \frac{1}{|C_j|} \sum_{x_i \in C_j} x_i$$
- Iterating Until Convergence
- Steps 2 and 3 are repeated until centroids no longer change significantly.
Choosing the Right Value of K
Selecting an optimal K value is crucial for the accuracy of K-Means clustering. Popular methods include:
- Elbow Method: Plotting the inertia and identifying the “elbow” point.
- Silhouette Score: Measuring the compactness and separation of clusters.
- Domain Knowledge: Using real-world insights to choose meaningful clusters.
Practical example:
For instance, suppose the points in our space are the customers who visit a particular store; then, we have to cluster these points based on their shopping patterns.
- Data: In our dataset, two features are present: the amount spent on sports and digital products.
- Goal: For the purpose of this example, the clusters for the sample dataset will be set to three (k=3).
Step-by-step:
- Initialization: At this stage, three random points are chosen from the learning dataset and act as the starting centroids.
- Assignment: Find the distance from each determined centroid for each data point. In the next step, every data point is clustered around the nearest distance centroids.
- Update: To get the new centroid, it is the means of all the points falling in the same cluster.
- Iteration: These steps of assignment and updating should be repeated until the centroids’ values do not shift any further.
The following code is implemented in Python with the scikit-learn module. It aims to partition such data into K clusters, with each point being in the nearest cluster center. K-means attempt to move points in the same cluster closer to each other, thereby minimizing cluster variance. This method is quite effective when clusters are spherical and/or the sizes are almost equal.
import numpy as np
import matplotlib.pyplot as plt
from sklearn.cluster import KMeans

# Sample data: amount spent on sport and digital products
X = np.array([
    [105, 210], [125, 230], [140, 250], [160, 265], [210, 450],
    [215, 500], [225, 530], [240, 560], [290, 990], [315, 1000],
    [320, 1050], [330, 1070]
])

# Number of clusters
k = 3

# Create KMeans instance
kmeans = KMeans(n_clusters=k)

# Fit the model
kmeans.fit(X)

# Get cluster centroids
centroids = kmeans.cluster_centers_

# Get labels for each point
labels = kmeans.labels_

# Plot the data points with cluster assignments
plt.scatter(X[:, 0], X[:, 1], c=labels, cmap='viridis')
plt.scatter(centroids[:, 0], centroids[:, 1], s=300, c='red', marker='X')
plt.xlabel('Amount Spent on Groceries')
plt.ylabel('Amount Spent on Clothing')
plt.title('K-Means Clustering')
plt.show()
Explanation:
- Data preparation: A sample data set involving the values of sports and digital products was developed to be used when carrying out an example.
- Number of Clusters: The number of clusters, or 𝑘, is 3.
- KMeans Instance: In the KMeans class, the initialization parameters include the number of clusters to be created.
- Fit the Model: The fit method calculates the centroid of the clusters and categorizes the data points into near clusters.
- Plotting: A Python graph library called matplotlib visualizes the clusters. The data points are assigned color according to the number of clusters, and centroids are depicted by X in red.
Use Cases of K-Means Clustering
K-Means is widely applied in different industries:
- Customer Segmentation: Grouping users based on purchasing behavior.
- Image Compression: Reducing image size using color clustering.
- Social Media Analysis: Detecting trends and user communities.
- Anomaly Detection: Identifying fraud or cybersecurity threats.
FAQ
1. What is K-Means Clustering used for?
It is used for data segmentation, customer profiling, and pattern recognition.
2. How do I choose the best K value?
The Elbow method and Silhouette score are commonly used techniques.
3. Can K-Means handle categorical data?
No, K-Means is designed for numerical data. Use K-Modes for categorical clustering.
4. What are the alternatives to K-Means?
Hierarchical Clustering, DBSCAN, and Gaussian Mixture Models (GMM) are alternatives.
5. What is K-Means++?
K-Means++ improves standard K-Means by smartly initializing centroids for better convergence.