What is data science?
The goal of the diverse area of data science is to use computer science, statistics, and mathematics to extract valuable insights from data. Data scientists gather, process, analyze, and visualize data to identify trends, patterns, and insights that might influence decisions. Data science has become essential for businesses to stay innovative and competitive as a result of the growth of data across industries.
Data scientists follow a set of procedures in practice, beginning with gathering data (from several sources) and followed by data cleaning (to handle missing or inconsistent data). They then apply exploratory data analysis to understand trends and relationships within the data. Finally, data scientists use machine learning and statistical models to make predictions, classify data, or cluster information, depending on the business objective.
From forecasting consumer behavior and identifying financial transaction fraud to improving healthcare outcomes and tailoring content recommendations, data science can solve a wide range of issues thanks to this methodical approach. Data science turns raw data into useful insights, enabling organizations to make data-driven, well-informed decisions.
Work flow of the data science
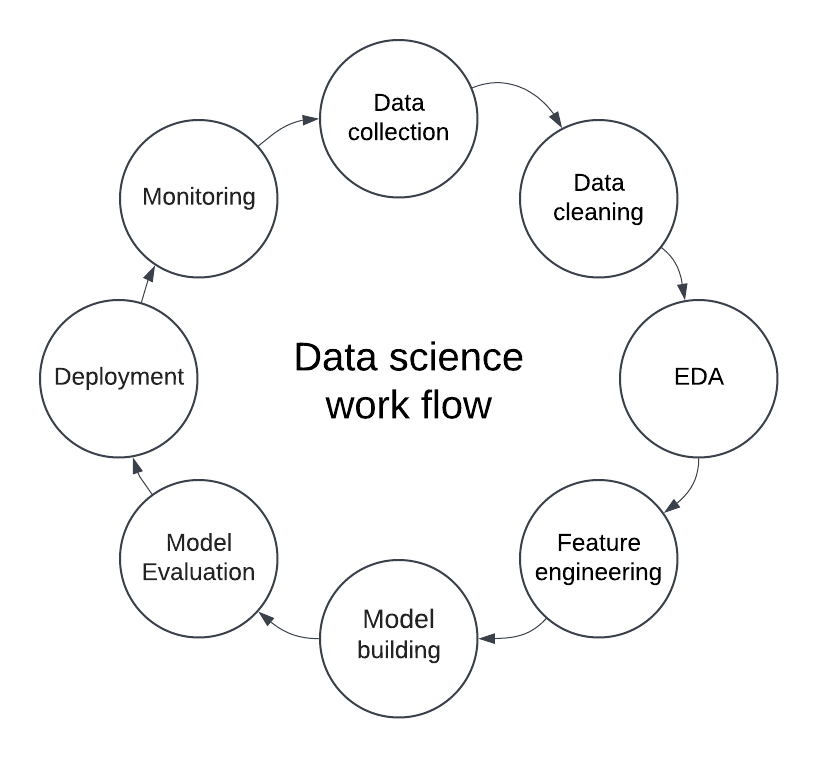
The data science workflow is a step-by-step process data scientists use to work with data and solve problems. Imagine it like a recipe where each step helps us turn “raw” data (like ingredients) into valuable insights (like a delicious meal). Here’s how the workflow typically looks:
1. Data Collection
It is the first step, where we gather all the necessary data. Think of it like collecting ingredients for a recipe. We can collect data from many places, like databases, websites, or even sensors. For example, if we want to study people’s shopping habits, we might collect data from online stores about what people buy, how often, and at what time of day.
2. Data Cleaning
Raw data is often messy! It might have errors, missing pieces, or information we do not need. Therefore, we clean up raw data, like cleaning and slicing the items before cooking. For instance, if some records have missing values (like the price of an item not being recorded), we might fill in the gaps or remove those records to ensure the data is accurate.
3. Exploratory Data Analysis (EDA)
Once the data is clean, we explore it to understand its patterns. It is like tasting each ingredient to see if it’s too spicy, salty, or just right. We might create charts or look at averages and trends. For example, we could look at which items are most popular or if sales are higher on weekends. It helps us get a “feel” for the data.
4. Feature Engineering
In this step, we transform the data to make it more useful for analysis, like seasoning and preparing ingredients for cooking. We might create new data points or reorganize the data. For example, if our data has both the “date of purchase” and “time of purchase,” we might combine these to create a “day of the week” feature, which can show if certain days have more sales.
5. Model Building
Now we’re ready to build a model, like following a recipe to cook the dish. We employ statistical and machine learning algorithms to identify trends or forecast outcomes. For example, a model could predict which products people might buy based on past purchases.
6. Model Evaluation
After building the model, we evaluate its performance to check whether it’s “cooked” just right, similar to the cooking process. We compare the model’s predictions with actual results to see if they’re accurate, like tasting the dish to see if it needs more seasoning. If our model needs to be more precise, we might adjust it or try a different one.
7. Deployment and Monitoring
Finally, we use the model in practice, like when presenting the food to customers. The model might also be used in an app or website to make real-time recommendations. For example, an e-commerce site might use our model to suggest products customers will likely buy. We also monitor the model to ensure it performs well and adjust it as needed.
As illustrated in Figure 1, each step in this workflow helps us move from raw data to actionable insights, turning complex data into clear, useful answers.

Figure 1
Applications and impact of data science
Data science has a profound impact across industries.
- Healthcare: Predicting patient outcomes and improving diagnostics.
- Finance: Detecting fraud and managing risk.
- Retail: Personalizing customer experiences and optimizing inventory.
Essential tools and skills for data science
- Programming languages: Skill in Python or R programming is required for data analysis
- Data manipulation: Pandas, NumPy
- Data visualization: Matplotlib, Seaborn
- Machine learning: Scikit-learn, TensorFlow
The next topic explains a real-world Python code example for each data science workflow stage.

