
Explainable AI for business decisions is transforming how organizations make strategic choices in today’s fast-paced environment. By combining advanced machine learning with transparent, human-understandable explanations, executives can trust the insights driving their actions. Instead of relying on black-box predictions, decision-makers gain clarity on why a model suggests a particular course, ensuring alignment with compliance requirements, ethical standards, and business objectives. This approach not only speeds up decision-making from weeks to hours but also improves return on investment (ROI) through data-driven strategies backed by evidence and accountability. Moreover, employing explainable AI for business decisions helps organizations navigate complex environments effectively.
Explainable AI for Business Decisions: What It Solves
Understanding the Role of Explainable AI for Business Decisions: It empowers organizations with a clear framework to enhance decision-making by making complex AI models transparent and understandable. By leveraging frameworks that promote transparency and accountability, organizations can align strategic objectives with day-to-day operational choices more effectively. This approach fosters a culture of data-driven decision-making, where stakeholders trust AI model outputs and fully understand the rationale behind each prediction.
SHAP (SHapley Additive exPlanations) often serves as a model-agnostic standard for attributing feature importance, helping decision-makers see which variables drive specific predictions. LIME (Local Interpretable Model-Agnostic Explanations) provides rapid, localized approximations to illustrate individual predictions in real time. Complementary methods such as partial dependence plots, accumulated local effects, and conventional feature importance scores offer broader perspectives, enabling both granular and high-level insights.
From a business perspective, the value can be summarized in three key areas:
- Operational trust—Stakeholders can validate AI outputs before execution, reducing risk.
- Regulatory compliance—Supports requirements under frameworks like the EU AI Act and GDPR by ensuring traceability and auditability.
- Root cause analysis—accelerates identification of controllable levers that drive performance outcomes.
The following table outlines the most common XAI methods used in decision support for businesses.
| Technique | Scope | Advantages | Limitations |
|---|---|---|---|
| SHAP (Shapley Additive Explanations) | Global & local | Consistent, model-agnostic | High compute cost for large datasets |
| LIME (Local Interpretable Model-agnostic Explanations) | Local | Fast, flexible | Instability on minor input changes |
| PDP (Partial Dependence Plots) | Global | Visual feature-impact analysis | Assumes feature independence |
| Feature Importance | Global | Low overhead | Limited for non-linear dependencies |
XAI Architecture for Executives
As organizations continue to adopt explainable AI for business decisions, the focus on ethical AI practices and compliance becomes increasingly important, ensuring that decisions are not just data-driven but also fair and justifiable. A production-grade explainable AI system can be designed using an Executive Decision Support Framework, incorporating both Ante-hoc and Post-hoc approaches to enhance transparency, validation, and decision confidence, as shown in Figure 1.
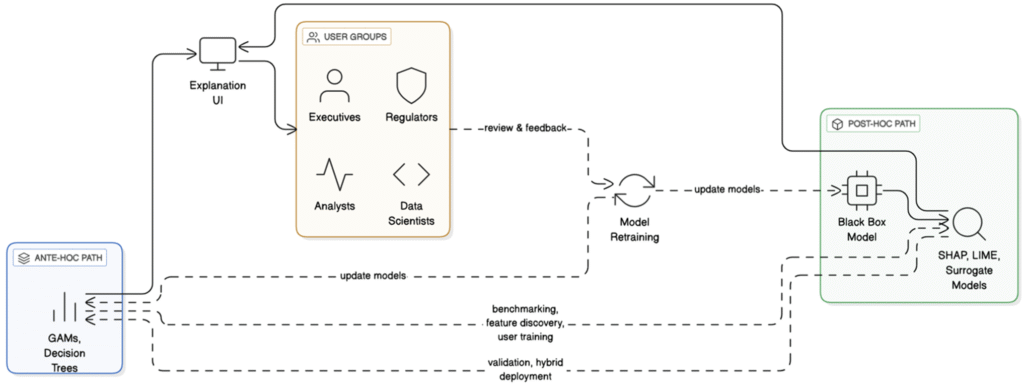
Figure 1: Explainable AI (XAI) Architecture
SHAP and LIME Explanations in Practice
This architecture integrates data ingestion, preprocessing, predictive modeling, explainability, and narrative generation into a single, seamless flow from raw datasets to boardroom-ready recommendations, ensuring that insights are not only accurate but also interpretable and actionable. In this architecture, the Ante-hoc path utilizes inherently interpretable models, such as Generalized Additive Models (GAMs) or decision trees, providing direct explanations to the Explanation UI for consumption by executives, regulators, analysts, and data scientists. The Post-hoc path utilizes high-performance black-box models (e.g., GRU, LSTM, XGBoost, LightGBM). It applies explanation techniques such as SHAP, LIME, and surrogate models before presenting the outputs in the UI. Feedback from user groups drives model retraining, while both paths interact for benchmarking, feature discovery, user training, validation, and hybrid deployment.
- Data Ingestion: Operational (ERP, CRM, IoT), external (market indices, weather), and historical datasets.
- Data Preprocessing: Missing value removal, scaling (StandardScaler, MinMaxScaler), and feature extraction.
- Predictive Model: Time-series (GRU, LSTM) or structured data (XGBoost, LightGBM), applied in either Ante-hoc or Post-hoc flows.
- Explainability Layer: For Ante-hoc, explanations are generated inherently; for Post-hoc, methods such as SHAP and LIME quantify feature contributions per instance.
- Narrative Layer: Generative AI transforms feature attributions into domain-specific decision reports. It acts as the bridge between data science outputs and executive decision-making. It ingests both the raw predictions and their corresponding explanations, such as the top contributing features from SHAP, and uses generative AI to produce concise, domain-specific reports. Each narrative clearly states the recommended action, the top three factors driving that recommendation, and the model’s confidence level. It enables executives to quickly interpret, validate, and act on AI-driven insights, thereby reducing the gap between analytics and strategic action.
Outputs are integrated with BI dashboards or automated workflows for actionable insights.
How Ante‑hoc and Post‑hoc Complement Each Other
Ante‑hoc models anchor governance with clear, rule‑like behavior that is easy to review. At the same time, Post‑hoc explanations unlock the accuracy of complex models without sacrificing transparency. Used together, they provide three benefits.
- Improve model selection: leaders can compare an interpretable baseline against a black‑box alternative on both accuracy and explainability stability, selecting the option that balances risk and reward.
- Support feature discovery: insights from a high-capacity model reveal nonlinear interactions that can be distilled into an a Priori surrogate or translated into business rules.
- Strengthen change management: when a policy update or market shock occurs, the Ante‑hoc path offers immediate interpretability for quick adjustments, and the Post‑hoc path validates whether the new patterns are being captured and explained consistently.
AI Explainability for Compliance
Transparency is operationalized through consistent assets: a data lineage view that shows which features feed each model, an explanation schema that standardizes how attributions are stored and rendered, and an audit trail that binds every decision to its inputs, model version, and explanation payload. Policies specify when only Ante‑hoc models are permitted, such as in high‑risk decisions, and when Post‑hoc models are acceptable with additional controls like explanation stability tests, adversarial checks, and human‑in‑the‑loop approvals. Access control ensures sensitive features are masked in end‑user narratives while remaining available to risk and compliance teams for review.
Case Study: Demand-Risk Forecasting and Capital Allocation
Consider a retailer that must allocate working capital across regions while balancing expected demand and operational risk. A time-series model forecasts demand at the store level, and a gradient-boosted model estimates a risk index from operational signals. In the Post-hoc path, SHAP explains week-ahead risk surges by highlighting features such as inventory turns, supplier delay probability, or local events. In the Ante-hoc path, a policy-oriented surrogate model translates these insights into clear capital allocation rules, such as minimum inventory coverage thresholds or dynamic reorder limits.
When delivering these results to decision-makers, the Narrative Layer generates a concise executive report. For each region, it presents the recommended allocation, lists the top three drivers influencing that recommendation, and states the degree of confidence in the outcome.
For example: “Allocate $500,000 to Region A this week, driven primarily by high demand forecast (+0.42), low supplier delay risk (+0.31), and upcoming promotional activity (+0.27). Confidence level: 87%.”This direct linkage between prediction, explanation, and action enables faster, more transparent capital allocation decisions that are easy to defend in both operational and regulatory contexts.
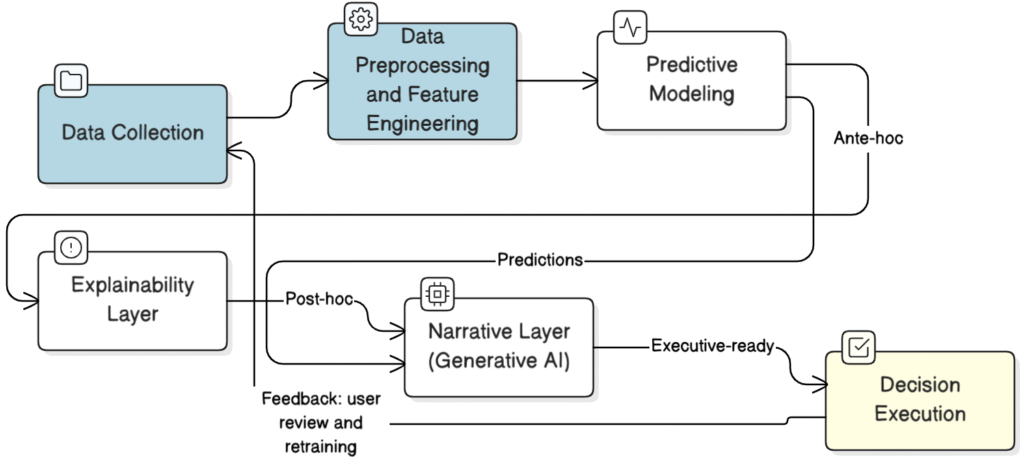
Figure 2: Executive Decision Support Architecture for Explainable AI
As shown in Figure 2, this architecture integrates Ante-hoc and Post-hoc approaches into a unified decision-support workflow. It begins with Data Collection, including operational (ERP, CRM, IoT), external (market indices, weather), and historical sources, as well as synthetic datasets for specialized scenarios such as supply chain or capital allocation. Data Preprocessing and feature engineering handle missing-value removal, feature extraction, and scaling (StandardScaler, MinMaxScaler), utilizing sequential splits for supply chain forecasts and stratified random splits for capital allocation.
The Predictive Modeling Layer supports time-series models (e.g., GRU using the past 72 hours of records) and structured-data models (e.g., XGBoost for capital allocation). The Explainability Layer applies SHAP to identify top contributing features for each prediction in the Post-hoc path. At the same time, Ante-hoc models (e.g., GAMs, decision trees) provide inherent explanations without additional computation.The Narrative Layer transforms these explanations into executive-friendly reports using generative AI (e.g., OpenChat). Each report contains the recommended decision, the top three drivers influencing that recommendation, and the model’s confidence level, allowing decision-makers to understand and validate the outputs quickly. Finally, the Decision Execution Layer integrates these narratives into BI dashboards or automated workflows, enabling transparent, data-driven actions in the boardroom.
Evaluation Framework and KPIs for XAI
Measuring only accuracy is insufficient. Organizations should track a minimal set of explainability KPIs alongside model metrics:
- Explanation fidelity: how closely a surrogate or local explainer matches the black‑box decision in the relevant region of the feature space.
- Stability over time: whether the top drivers for similar cohorts remain consistent across weeks and releases.
- Actionability coverage: the proportion of explanations that cite features a business can influence.
- Review efficiency: average time for an analyst or approver to understand and validate a recommendation.
These KPIs sit alongside conventional metrics, such as MAPE for forecasts or AUC/F1 for classification, as well as service-level measures like latency and throughput.
MLOps and Deployment Considerations
Production success depends on repeatability and cost control. Caching SHAP values for frequently scored segments reduces compute overhead. Batch explanation jobs can pre-materialize narratives for scheduled decisions. At the same time, real-time scoring includes lightweight, on-demand explanations for ad hoc requests. A feature store with time travel guarantees consistent training and serving data. Model and explanation artifacts are versioned together to ensure that any past decision can be reconstructed with its exact rationale. Monitoring covers data drift, performance regression, and explanation drift, triggering retraining or policy review when thresholds are breached.
Python Example (XGBoost + SHAP + Narrative)
import shap, xgboost as xgb
import numpy as np
import pandas as pd

#===== Randon generated data =====
rng = np.random.RandomState(0)
X = pd.DataFrame({
    "inventory_turns": rng.gamma(2.0, 2.0, 500),
    "supplier_delay_prob": rng.beta(2, 8, 500),
    "promo_intensity": rng.uniform(0, 1, 500),
    "local_event_index": rng.poisson(0.3, 500)
})
y = (0.4*X["supplier_delay_prob"] + 0.2*X["promo_intensity"] +
     0.1*X["local_event_index"] - 0.05*X["inventory_turns"] +
     rng.normal(0, 0.05, 500) > 0.25).astype(int)

model = xgb.XGBClassifier(
    n_estimators=200, max_depth=3, learning_rate=0.05,
    subsample=0.9, colsample_bytree=0.9, eval_metric="logloss"
)
model.fit(X, y)

#===== TreeExplainer for tree models (works with XGBoost) ====
explainer = shap.TreeExplainer(model)
sample = X.sample(3, random_state=42)
shap_values = explainer(sample)  # SHAP Explanation

def narrate(row: pd.Series, sv) -> str:
    """
    row: a single-row Series from X
    sv:  shap.Explanation for that same row OR a 1D numpy array of SHAP values
    """
#===== Get the 1D vector of shap value =====
    vals = getattr(sv, "values", sv)  # Explanation
    vals = np.asarray(vals).reshape(-1)  # 1D

    #===== Indices of top 3 drivers by absolute contribution =====
    top_idx = np.argsort(np.abs(vals))[::-1][:3]
    items = []
    for j in top_idx:
        sign = vals[j]
        items.append(f"{row.index[j]} ({'+' if sign>=0 else ''}{sign:.3f})")

    proba = float(model.predict_proba(row.values.reshape(1, -1))[0, 1])
    return f"Recommendation confidence {proba:.2%}. Top drivers: " + "; ".join(items) + "."

# ===== Print narratives for the sampled rows =====
for i in range(sample.shape[0]):
print(narrate(sample.iloc[i], shap_values[i]))In this demonstration, the model outputs both a predicted confidence level and a ranked list of the top three contributing features for each instance. The SHAP values indicate the direction and magnitude of each feature’s influence on the prediction, with positive values increasing the likelihood of the recommended action and negative values decreasing it. For example, a negative SHAP value for promo_intensity suggests that higher promotional intensity reduces the model’s confidence in the recommendation for that specific case. Presenting this information alongside the prediction enables decision-makers to understand not only what the model predicts but also why it arrived at that conclusion.This sketch mirrors the Post‑hoc path by computing attributions and converting them into a compact narrative. In production, you would persist the explanation payload, template the narrative with domain language, and present it through the Explanation UI.
Limitations and Practical Safeguards
Explanations can be misleading if not validated for their fidelity and stability. Local approximations may vary with small input changes, and global summaries can mask heterogeneity across cohorts. Attribution does not imply causality; therefore, policy changes should be vetted through controlled tests or counterfactual analysis. Finally, explanation computation can be expensive at scale; batching, sampling, and caching strategies help control cost without sacrificing transparency for high‑stakes decisions.
Future Directions
Three directions are promising.
- Explanation‑aware training that enforces monotonicity or sparsity during learning can improve trust.
- Causal modeling and counterfactual simulation can turn explanations into testable levers for intervention design.
- Human feedback loops can be formalized to continuously align model behavior and narratives with evolving business policies.
Conclusion
Explainable AI allows organizations to pair predictive power with operational clarity. By combining Ante‑hoc and Post‑hoc approaches in a single architecture, as shown in Figure 2, leaders gain decisions they can understand, audit, and act upon. A disciplined workflow, strong governance, practical KPIs, and a tightly integrated MLOps foundation turn explanations from a research artifact into a daily management capability. Ultimately, explainable AI for business decisions is not just a technological advancement; it represents a shift towards more responsible and conscious business practices.
FAQ – Explainable AI for Smarter Business Decisions
What is explainable AI for business decisions?
Explainable AI (XAI) for business decisions is the use of AI models that provide clear, human-understandable reasoning for their predictions, enabling leaders to trust, audit, and act on AI-driven insights.
Why is explainable AI important for executives?
Executives rely on AI outputs to make high-impact decisions. Explainable AI ensures they understand the factors influencing predictions, which builds trust, improves accountability, and supports compliance with regulations such as the EU AI Act and GDPR.
How do SHAP and LIME improve AI explainability?
SHAP and LIME are model-agnostic methods that show how different features influence a model’s predictions. They help identify key drivers, validate results, and ensure decisions align with business and regulatory requirements.
How does XAI support regulatory compliance?
XAI provides transparent decision-making processes that meet legal requirements for traceability and fairness, such as those outlined in the EU AI Act and GDPR, reducing regulatory risks.
Can explainable AI improve ROI?
Yes. By increasing trust, reducing errors, and enabling data-driven decision-making, explainable AI helps organizations optimize operations, minimize risks, and maximize return on investment.